GitHub's 2026 flood: three times the repos, three times the code
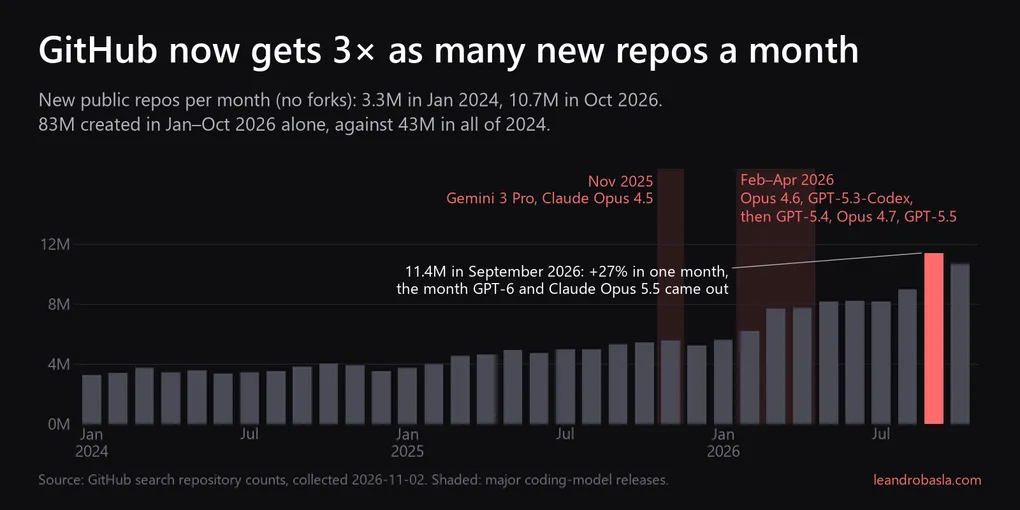
New public repos per month have tripled since early 2024, and the typical new repo is about three times bigger. Most of the jump lines up with two waves of coding-model releases.
I’m always trying to keep up with the latest releases and popular repos so I can apply them to my work and my personal projects. Lately I’ve been seeing so many new task-focused repos that I started to wonder: when does it make sense to keep cloning, and when should I just tell an agent to code exactly what I need?
Before I could answer that, I needed to know what’s actually in those new repos: how many there are, how big they are, who (or what) wrote them, and how tested they are. That turned into a research project built on random samples of 170,000 public repos. This is the first of three posts. It covers the first part: what changed on GitHub in 2026.
Why now? OpenAI and Anthropic are coming out with their own version control for coding agents, which will start pulling projects away from Git. That makes this one of the last snapshots in which GitHub holds a good-quality amount of data to pull.
Three times the repos
In January 2024 people created about 3.3 million new public repos (forks excluded). In October 2026 it was 10.7 million, after a peak of 11.4 million in September. Put another way: 83 million new repos in the first ten months of 2026, against 43 million in all of 2024 and 58 million in 2025.
The growth didn’t come as a smooth curve. It came in steps that held afterwards:
| Month | Change on the month before | What had just come out |
|---|---|---|
| March 2025 | +15% | Claude 3.7 Sonnet and the Claude Code preview |
| March 2026 | +24% | Claude Opus 4.6, GPT-5.3-Codex and GPT-5.4 |
| September 2026 | +27% | GPT-6 and Claude Opus 5.5 |
Three times the code
More repos would be unremarkable if they were the same kind of repo. They aren’t.
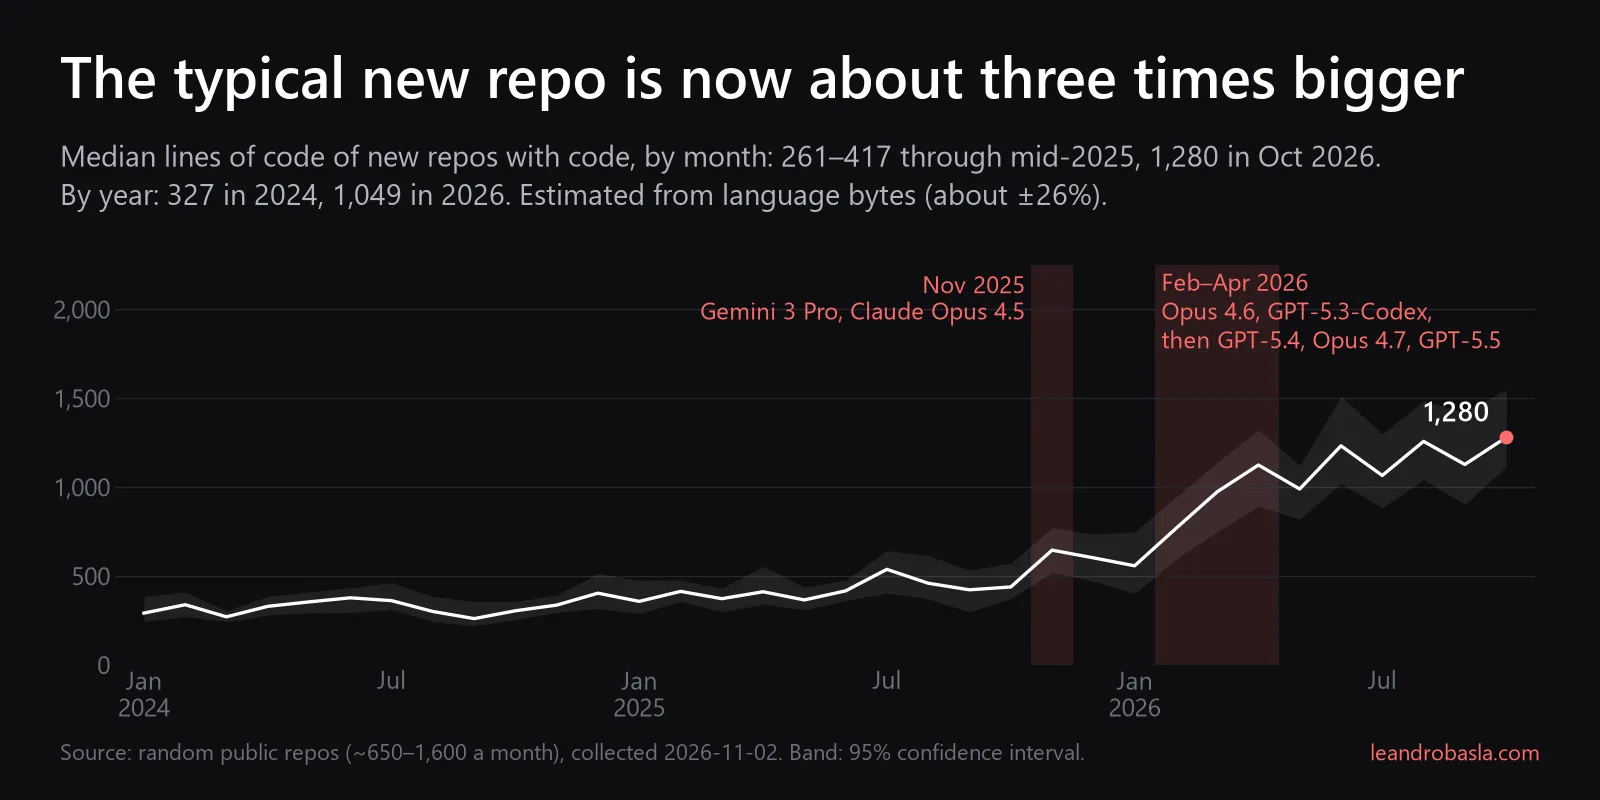
For a decade the typical repo actually shrank, from ~530–610 lines of code in 2010–2015 to ~300–365 in 2019–2024, as GitHub filled up with homework, tutorials and small experiments. Then it turned: the median new repo with code had 327 lines in 2024, 446 in 2025 and 1,049 in 2026.
Two milestones
Looking month by month, the median sits at roughly 300–400 lines through mid-2025, and then two moments stand out:
- November 2025, when Gemini 3 Pro and Claude Opus 4.5 came out: the first clear step up, to ~600 lines.
- February 2026, when Claude Opus 4.6 and GPT-5.3-Codex came out: the start of a steep climb through April (GPT-5.4, Claude Opus 4.7, GPT-5.5). Since then the median has stayed around 1,000–1,300 lines.
Both line up with stronger coding models. That’s timing, not proof of cause: agentic tools like Claude Code and Codex were also reaching more people at the same time.
It isn’t just that 2026 repos are younger
The obvious objection: 2026 repos are weeks or months old, so maybe they’re simply being measured at a different stage. To check, I read the git history of ~4,250 repos and measured every year’s repos at the same ages: 7, 90 and 365 days after creation.
At 90 days old, repos from 2016–2025 had a median of ~290–420 lines. Repos from 2026 had 1,036, and they were already that big a week after creation. In every year most repos reach close to their final size within 90 days. The jump is real.
Most of the flood is noise
More repos doesn’t mean more useful repos. Of everything created in 2026:
- 35% have no code at all: they’re empty, or hold only docs, notebooks or data.
- 6% have even one star, down from 14% in 2016.
So the repos anyone would ever find, let alone clone, are a thin slice of the flood. The language mix moved too, toward the web and Python:
| Primary language (share of new repos) | 2020 | 2024 | 2026 |
|---|---|---|---|
| HTML | 11.3% | 13.8% | 17.3% |
| Python | 8.2% | 9.4% | 12.3% |
| JavaScript | 15.8% | 14.8% | 10.0% |
| TypeScript | 2.7% | 5.2% | 9.1% |
| Java | 7.9% | 5.7% | 2.9% |
How I measured lines of code
Downloading 170,000 repos wasn’t an option, so lines of code are estimated. GitHub’s languages API reports how many bytes of each language a repo contains, and dividing the code bytes by 41 bytes per line gives the line count.
I calibrated that ratio by cloning 250 repos and counting their lines directly, then validated it on 306 more from 2010, 2020 and 2024. A typical estimate is off by about 26% either way, and the error is similar in every year, so the trend holds even if any single number is approximate. (GitHub’s own repo size field is useless for this: it includes git history and assets, and overestimated code size about 12× on random repos.) The full method is in the calibration report.
For each creation year from 2010 to 2026 I drew 10,000 fully random public repos with GitHub’s created: search filter. The monthly totals come straight from GitHub search’s repository count. Model release dates are from Wikipedia’s Claude and Gemini pages and Hidekazu Konishi’s OpenAI release timeline. The GPT-5.3-Codex date comes from third-party trackers only.
Limitations
- Lines of code are estimates, about ±26% per repo. Medians over thousands of repos are much more stable than that.
- Release timing isn’t cause. The milestones line up with model releases, but tools, pricing and awareness all changed in the same months.
- 2026 is still running. The sample covers repos created up to 2 November 2026, and the monthly counts run to October.
Next
So GitHub is flooded with new repos, and they keep getting bigger. The next post looks at who, or what, is writing them: what agent-made code looks like, from commit trailers and agent instruction files to suspiciously long READMEs.
Every number, chart and method is in the full research.